July 17, 2020
On Thursday, July 16, the National Oceanic and Atmospheric Administration (NOAA) issued their seasonal outlook forecasts for the August-September-October time period. If you recall, NOAA issues these outlooks on the third Thursday of each month. The way they should be interpreted, and the way NOAA has designed them, is to communicate the odds of precipitation or temperature being above, below, or near the long-term average (1981-2010). There is also the dreaded equal chances category, which is NOAA basically throwing its hands up, suggesting you flip a coin. They don’t actually want you to flip a coin, there just isn’t anything their forecast models are latching on to so there isn’t a clear signal either way. Summer precipitation usually falls into this category.
Temperature outlook
NOAA is expecting above normal temperatures across the country for Aug-Sep-Oct. Some of the largest probabilities (60% or greater) are over the Southwest, Northeast, and southern Florida. The high probabilities are based on good agreement among several of NOAA’s forecast models.
NOAA has also indicated poor soil moisture factored into their temperature forecast, especially for the Southwest and Southern High Plains region. Also, the delay in the onset of the Southwest summer monsoon favoring increased chances of above normal temperatures, pre-existing drought across the region is expected to worsen, in part due to reduced evapotranspiration and its impact on local moisture recycling.

Precipitation outlook
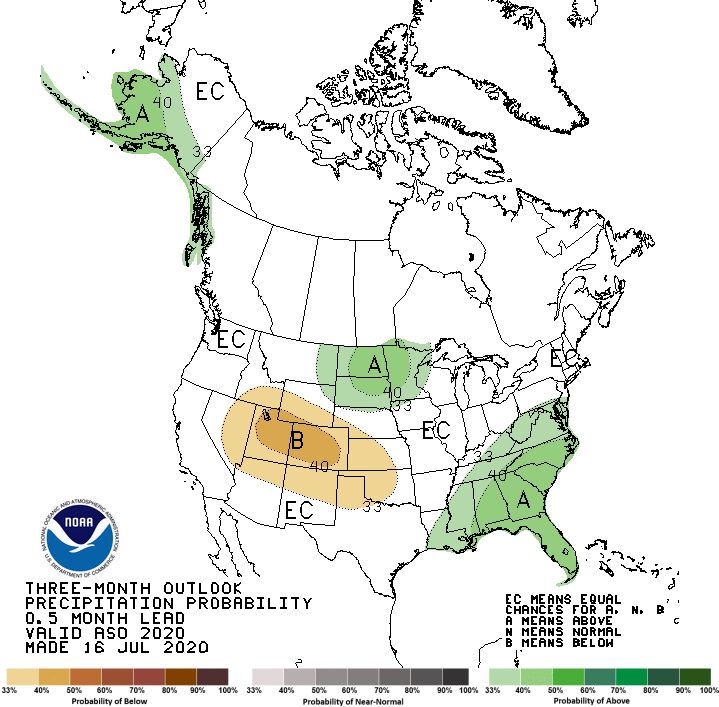
The precipitation outlook for Aug-Sep-Oct is indicating a tilt in the odds for above normal precipitation for parts of the Northern Plains and the adjacent portions of the Upper Mississippi Valley, due to good forecast model agreement and based on expected influences from a possible weak La Niña.
Above normal precipitation amounts are also indicated over the Southeast. Some of what is driving the odds for above normal precipitation in the Southeast is due enhanced tropical storms that often develop during August and September and track into the Southeast. Odds for below normal precipitation in Aug-Sep-Oct are highest in Nevada and southeastward into Texas and Oklahoma.
When looking beyond Aug-Sep-Oct, NOAA is beginning to show a drying trend starting in the Sep-Oct-Nov timeframe for the southern tier of the U.S., while the northern tier could see elevated precipitation amounts. This scenario is typical of a fall-winter La Niña pattern. NOAA is expecting the “northern wetness/southern dryness pattern” to persist into early 2021.

August precipitation
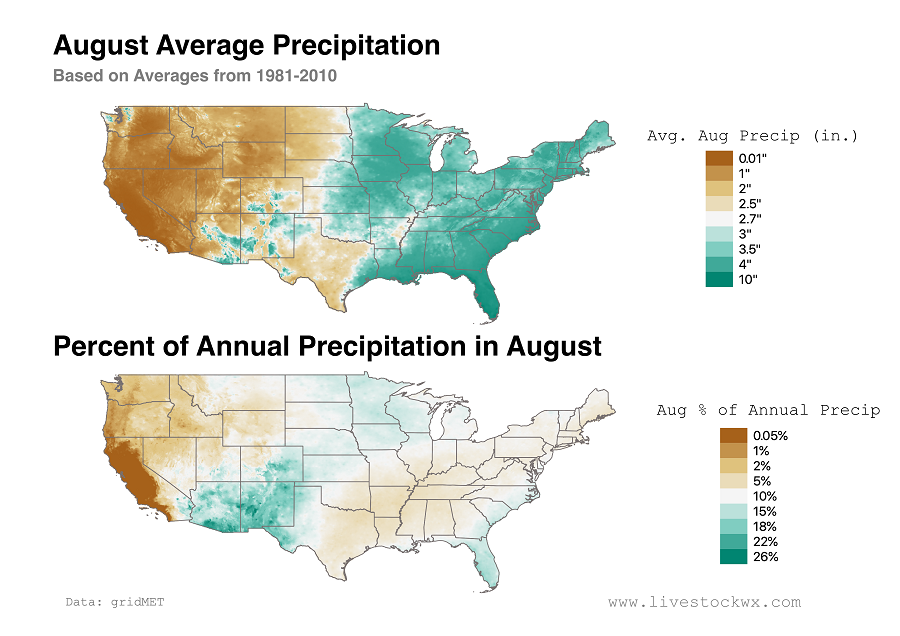
For those interested in average rainfall in August and what percentage of that rainfall contributes to the total average annual rainfall, we have provided two maps below. These are just for reference and will give you an idea of the areas where rainfall is most critical in August. Use these maps along with the current Drought Monitor and Seasonal Drought Outlook to get an idea of where things could be changing (both good and bad) in August.

Drought outlook
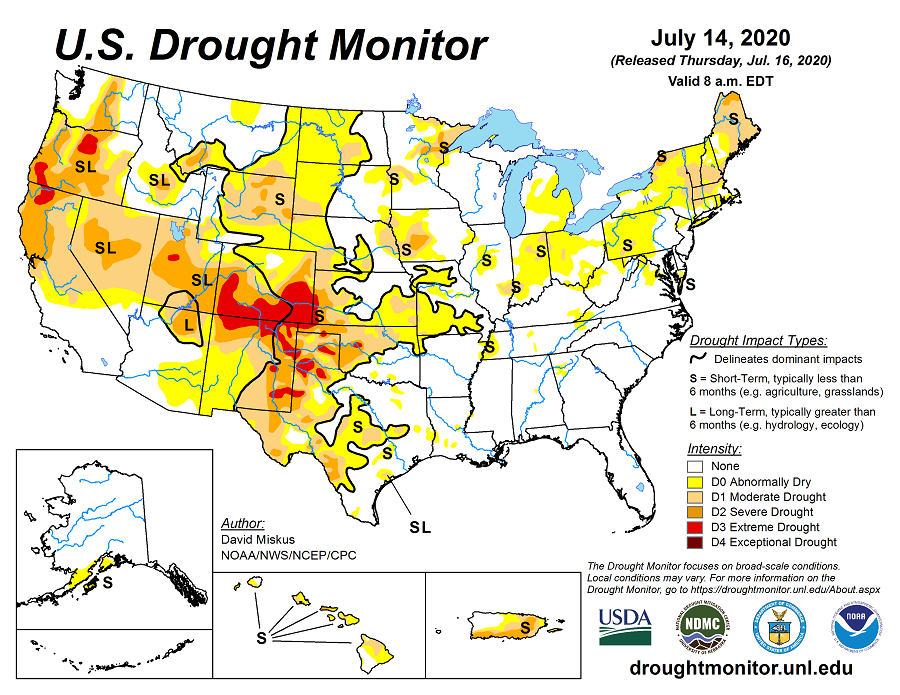
Since June, drought has been largely volatile, with areas of improving conditions interspersed with areas of intensification due to short-term rainfall deficits and very high temperatures. The biggest drought game in town continues to be the southern half of Colorado, North and East New Mexico, Southwestern Kansas, the Texas and Oklahoma Panhandles and down into the Texas South Plains/Far West Texas region.

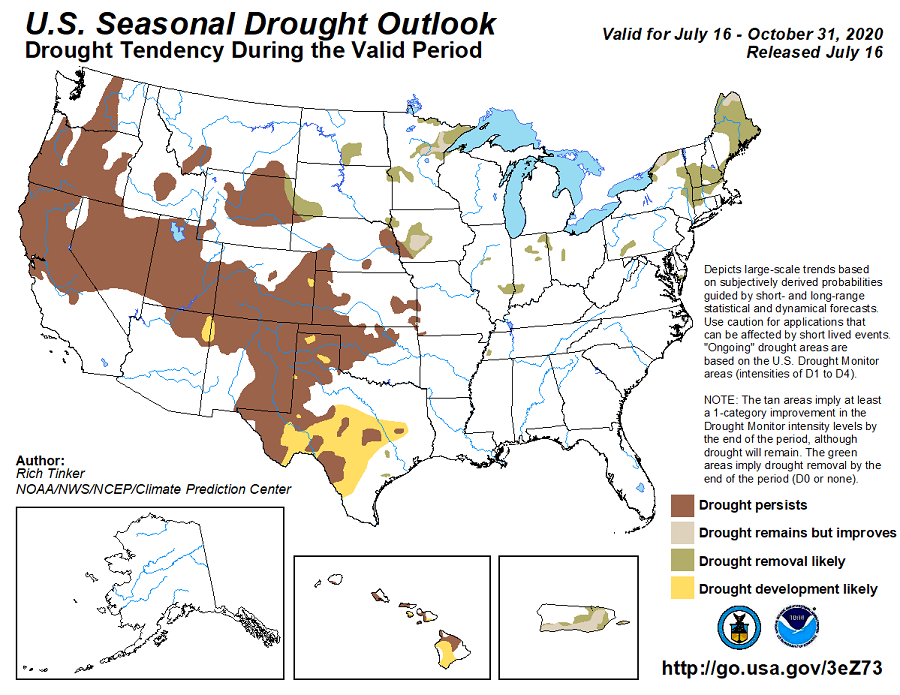
With the release of the Seasonal Drought Outlook on Thursday, July 16, NOAA is expecting that over the course of the next few months (through October 2020), “the pattern of drought intensity changes should effectively split the contiguous states into two areas.”
Drought is expected to improve in the Northeast, upper Midwest, and parts of the Northern Plains. Across the rest of the country, however, much of the current drought will likely persist and in some cases will intensify. Texas in particular could see drought expand into much of Central and Southwest regions.

