SPONSORED CONTENT
Oct. 2, 2020
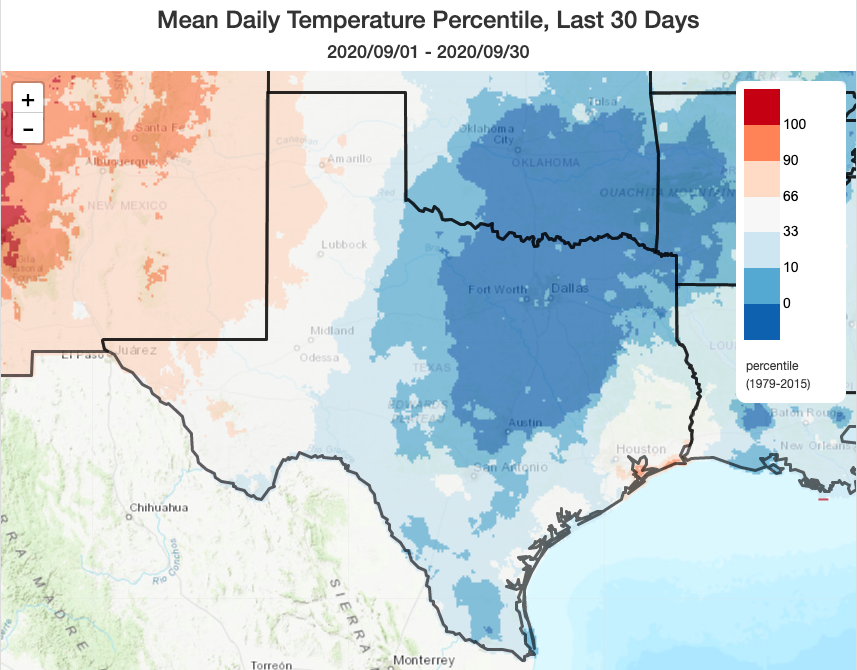
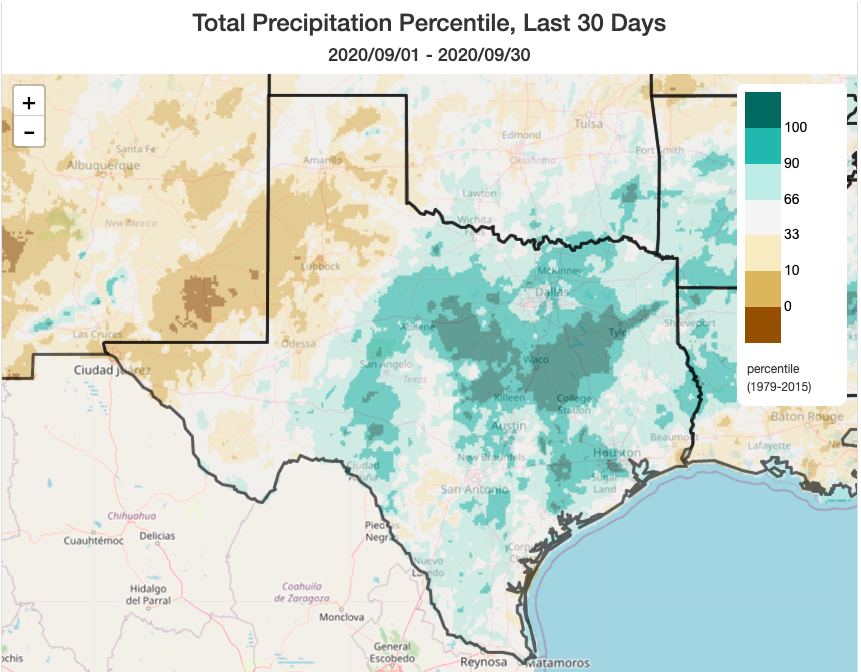
30-day temperature and precipitation trends
Over the last 30 days there has been a pretty stout gradient starting just east of Midland that has marked above-normal temperatures and below normal precipitation west of the gradient and cooler than average temperatures and good rainfall east of the line. In some cases, we may see some September records being broken.
The maps below show temperature and precipitation percentiles for the last 30 days. We should note the data are preliminary. The official September stats from NOAA will come out next week.
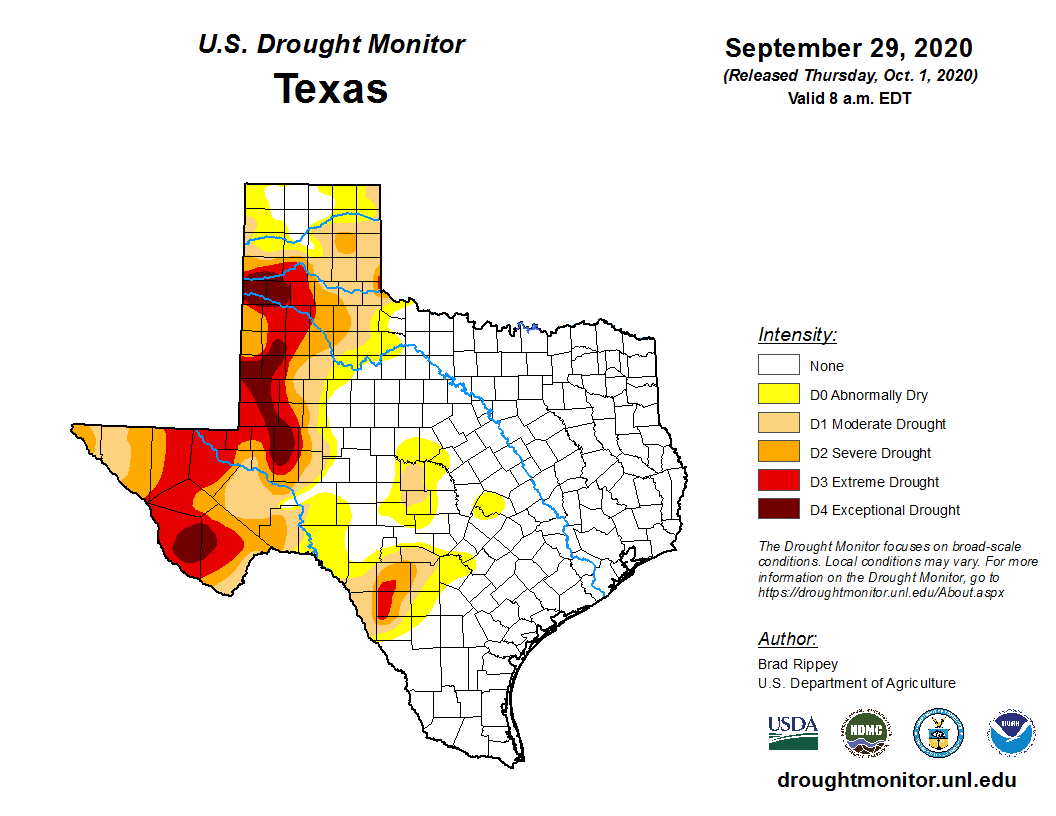
Drought status
As a result of the west-east gradient, we have seen expansion of drought in the Panhandle and improvement in conditions for the rest of the state over the last month. The below map shows the current U.S. Drought Monitor. Exceptional Drought (D4), the highest U.S. Drought Monitor category, was expanded this week into Parmer, Castro, and Midland counties, to name just a few.
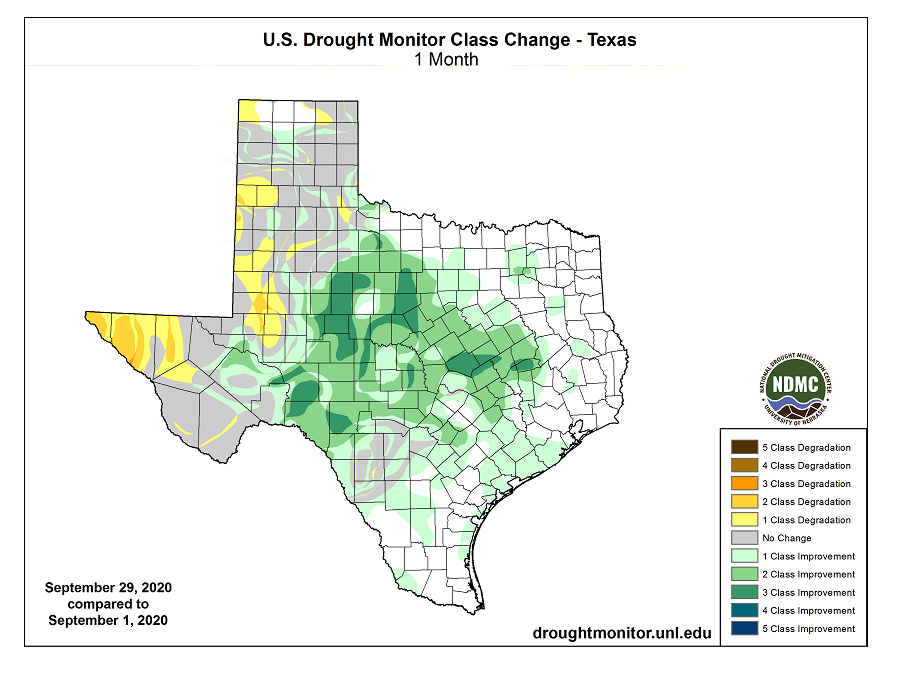
The second map shows the change in drought status over the last month. Yellow/orange colors are places were drought has expanded/intensified and greens and blues represent where drought has improved.
October and a 14-day forecast
The models are indicating October could be an unusually-dry month for a large part of the nation which will allow for plenty of good harvest days but for areas in need of moisture or dealing with fires, is not good news. The seven-day precipitation forecast is not showing much moisture for much of Texas.
Over the next one to three days there could be some measurable rainfall in North Texas and up into Oklahoma, but beyond that we’re not seeing much.
Going out eight to 14 days (see maps below), NOAA is giving strong odds of above-normal temperatures and moderate odds of below-normal precipitation.