Livestock Wx for 12-4-20: Historical view of strong La Niña events and a winter outlook
Last week, Mike Halpert from NOAA’s Climate Prediction Center posted an article that looked at the 20 strongest La Niña events since 1950 (Click here to read the to full article). We have pulled out some of the key points from the article and have also included precipitation and temperature maps for winter (Dec-Jan-Feb) from those 20 strong La Niña years.
Before we get started, though, just a quick reminder on why La Niña and El Niño events are so important: La Niña/El Niño events often significantly influence the winter climate over the U.S. This influence means that temperature and precipitation patterns are often more predictable. The winter season has the strongest linkage to La Niña/El Niño. There is less consistency for the other seasons.
Now for the main points from Dr. Halpert:
- La Niña developed during late summer and has strengthened. It is almost a certainty that it will continue through the winter.
- Most of the 20 strongest La Niña events since 1950 have been drier-than-average for much of the southern tier of the U. S., particularly along the Gulf Coast.
- Generally, wetter-than-average conditions occur along the northern tier of the U.S., although the difference from average winter conditions is smaller.

- Temperature patterns across the U.S. during La Niña winters are less consistent than those of precipitation.
- There is a pattern for above-average temperatures across the southern U.S., with below-normal winters across the northern Plains.
- Temperature trends during winter are likely being affected, however, by the long-term winter warming that has been observed, which could mean La Niña events early in the period tended to be cooler than later episodes.
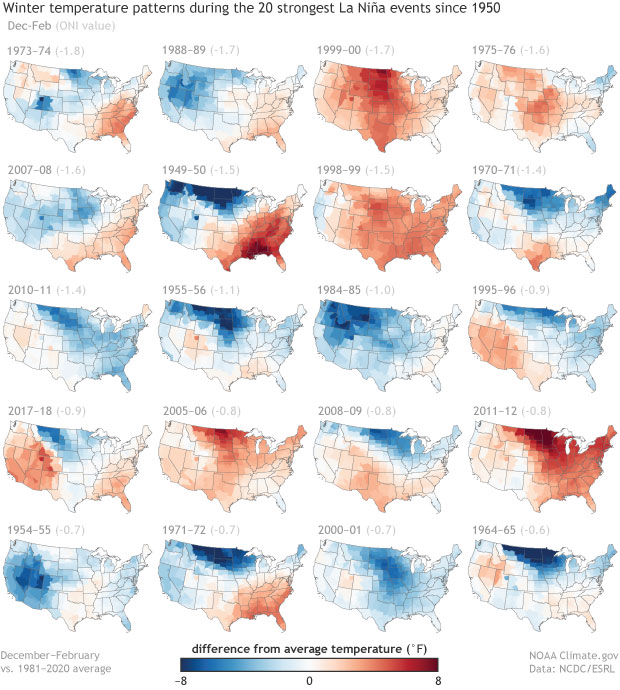
- Historically, the most reliable signal such as dry winter conditions in the Southeast during La Niña, only happens about 70-80% of the time.
- Climate forecasts can only tell us the most likely outcome, but they provide no guarantees, and the less likely outcome can and should occur at times.
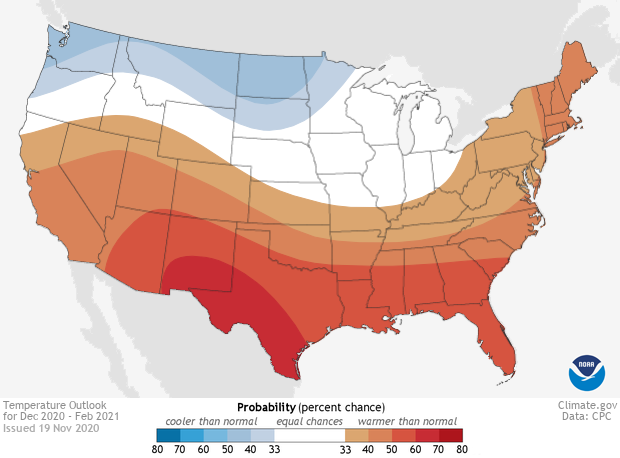
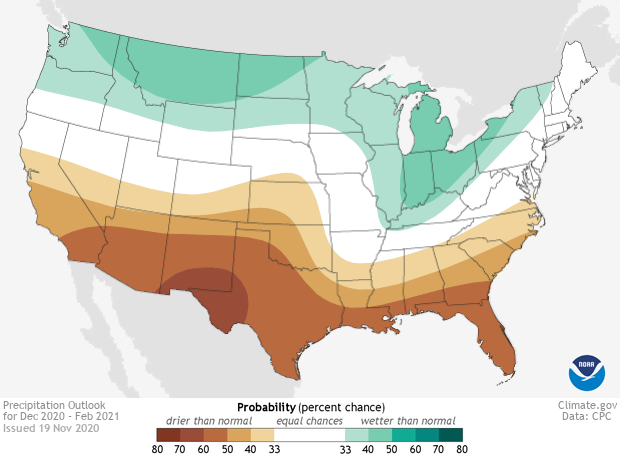
2020-2021 Winter Outlook
- The outlooks for this winter (Dec-Jan-Feb) are similar to the averages of all the individual maps in the precipitation and temperature figures above. The outlooks also look similar to the outlooks released for the winter of 2017-18, the last winter that was affected by a La Niña episode.
- The 2017-2018 Outlooks predicted pretty well what actually happened that winter.
- The 2020-2021 precipitation outlook favors below-normal precipitation across the entire southern tier of the country, with areas from Arizona eastward to Texas, along the Gulf Coast and in Florida most likely to experience a drier-than-average winter. The highest odds for below-average conditions are over parts of New Mexico and Texas at 60%.
- This year’s temperature outlook favors above-normal temperatures across the southern and central U.S. The odds exceed 50% from the Southwest eastward to across Texas, the Gulf Coast states, and into southern South Carolina. Probabilities are tilted toward colder-than-normal temperatures along the northern tier from the Pacific Northwest to western Minnesota.