SPONSORED CONTENT
May 8, 2020
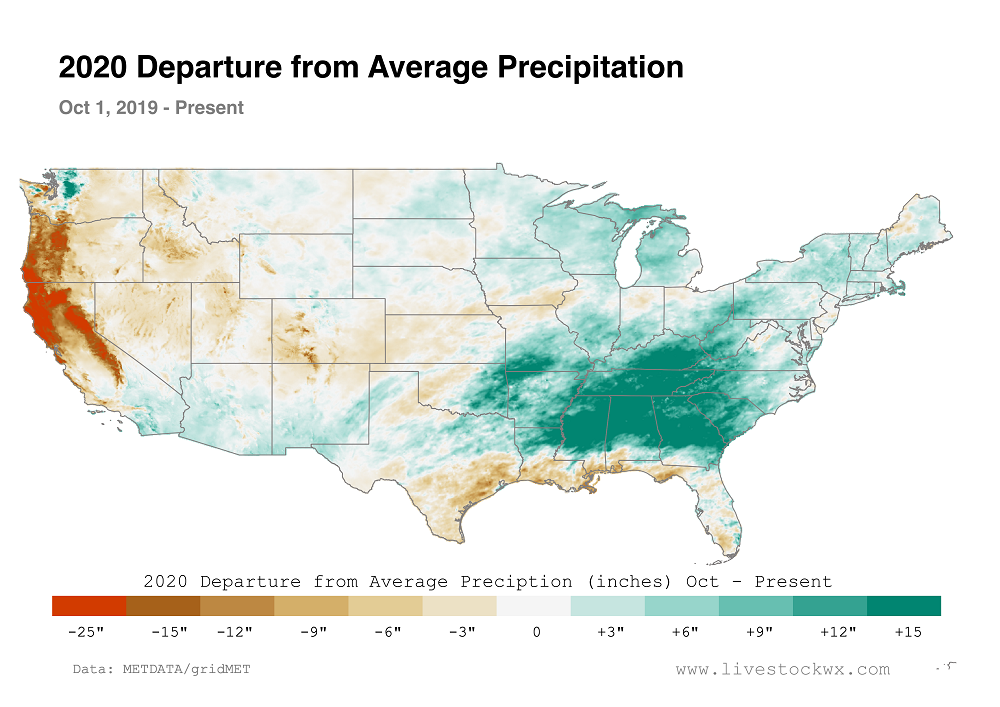
U.S. precipitation deficits: October – present
As we get into the growing season, we wanted to do a check-in on precipitation deficits since the start of the 2020 Water Year in October. The map below shows pretty clearly where it has been dry and tracks the U.S. Drought Monitor reasonably well. Some of the hot spots we’re watching are of course the Gulf Coast (which has improved somewhat over the last 10 days or so), California and the Pacific Northwest, and Western Kansas/Eastern Colorado.

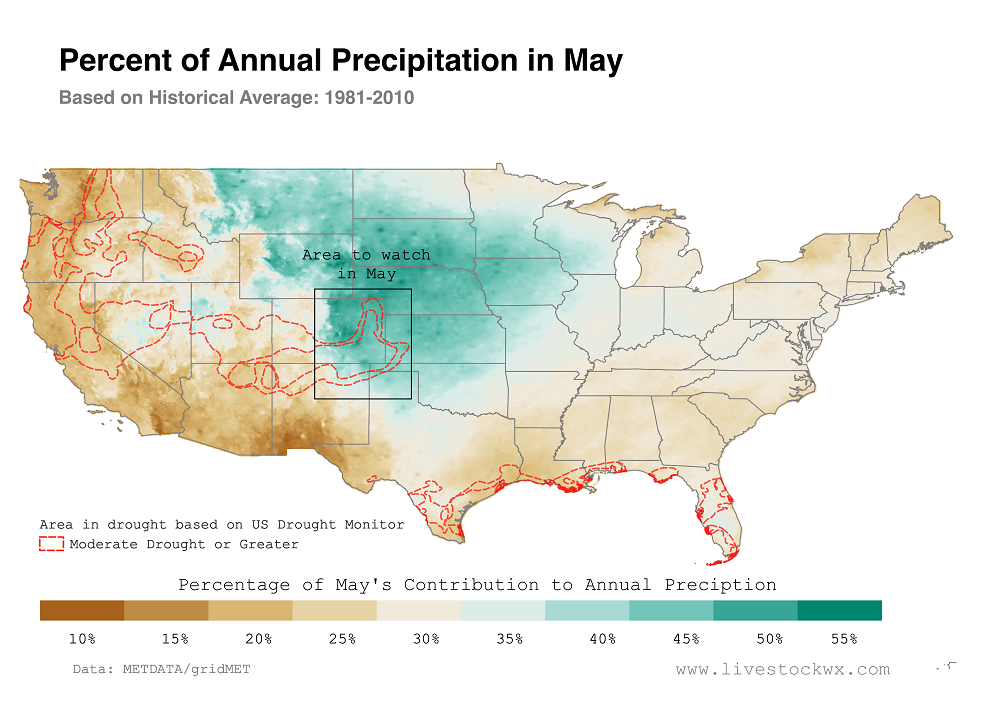
Percent of Annual Total Precipitation in May
The next image shows the contribution of the precipitation received in May—on average—to the total annual precipitation. On the map we overlaid the areas currently in Moderate Drought or greater based on the most recent US Drought Monitor. Parts of Colorado, Kansas, Oklahoma, and Texas (the area highlighted by the rectangle) receive a large portion of their total annual precipitation in May and are currently experiencing drought conditions. May could define whether the drought gets much more severe or drastically improves in these areas.

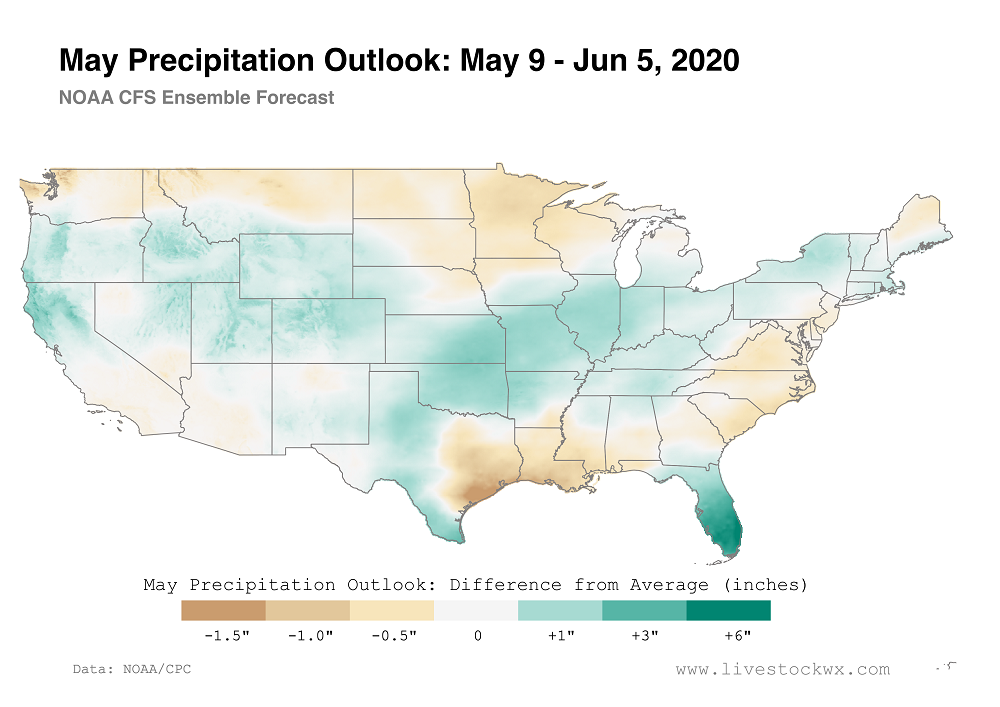
May Precipitation Outlook
The next image shows the Outlook from NOAA’s CFS ensemble precipitation forecast for the rest of May and into early June. While this is a long way out for the CFS model, there is an indication the Colorado, Kansas, Oklahoma and Texas area noted above could see near normal to slightly above normal precipitation for the next 28 days. This will likely not break the drought, but it hopefully will not make things worse. Not shown is the temperature forecast over the same period, which is expected to be near normal to slightly below normal. We’re going to continue watching how May unfolds and will be back next week with an update.

