SPONSORED CONTENT
May 1, 2020
Current Soil Moisture
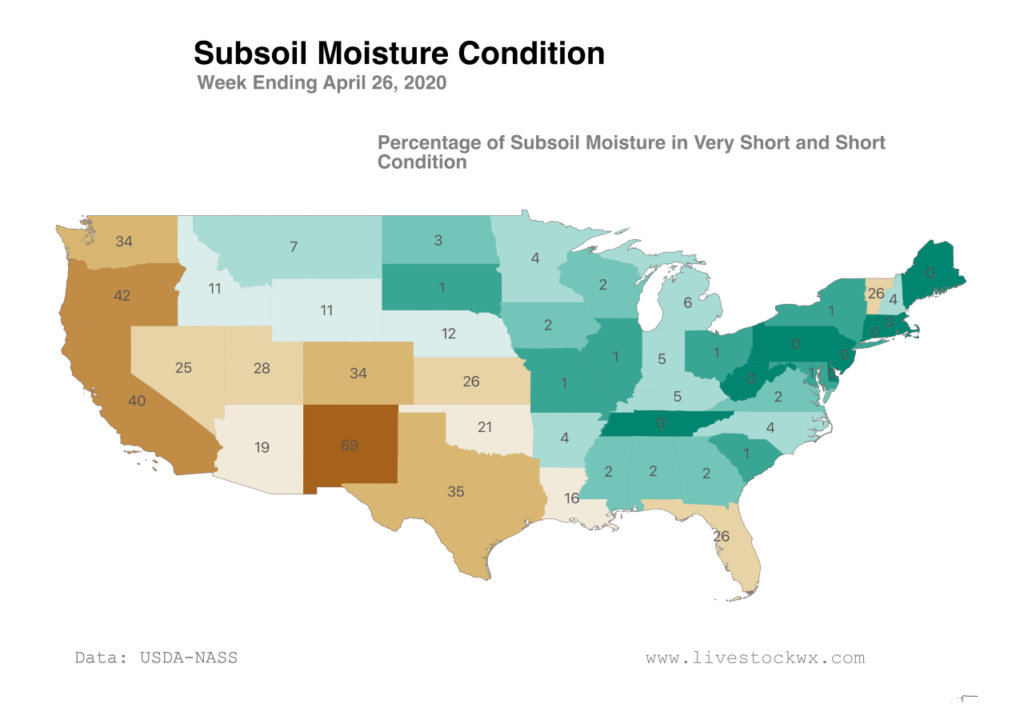
USDA is expected to release its first pasture and range report next week for the 2020 growing season. In anticipation of the report we thought we would take a look at the current state of soil moisture and where we stand with drought around the country (and the number of beef cows in drought). The first map below shows the percent area of soils considered in the Very Short and Short categories for each state by USDA.
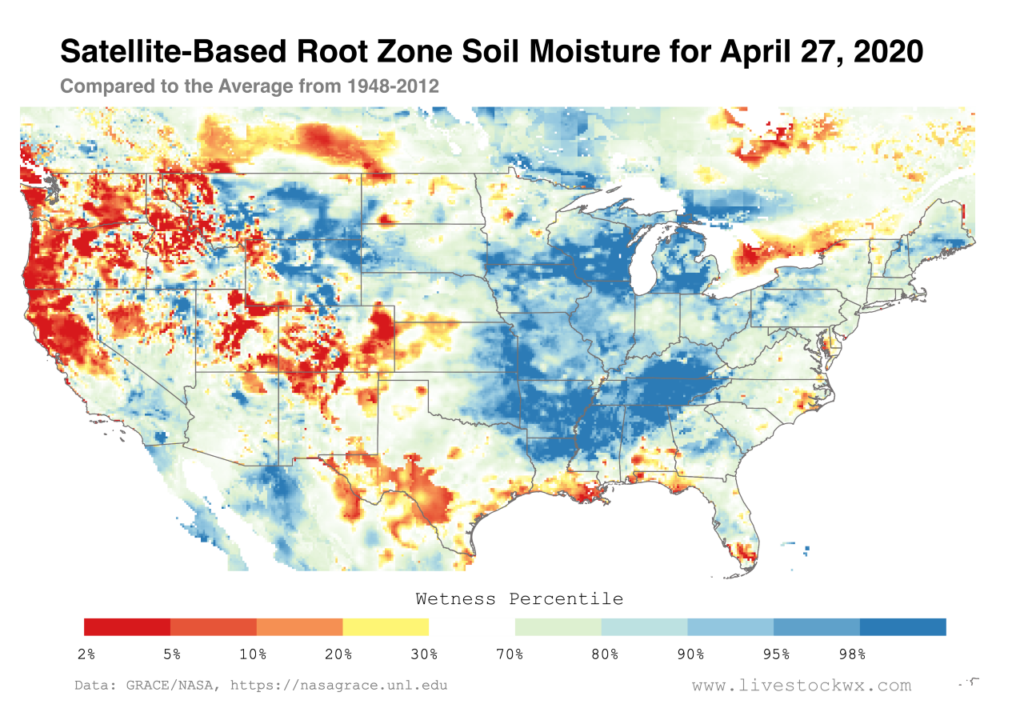
If you want a better break down for each state, we show below a new tool by NASA that estimates root zone soil moisture—among other things—each week for the Contiguous U.S. The data are from the GRACE satellite mission and are percentiles based on averages between the years 1948-2012. The most current map paints a fairly somber picture for parts of New Mexico, Colorado, and the West/Pacific Northwest.
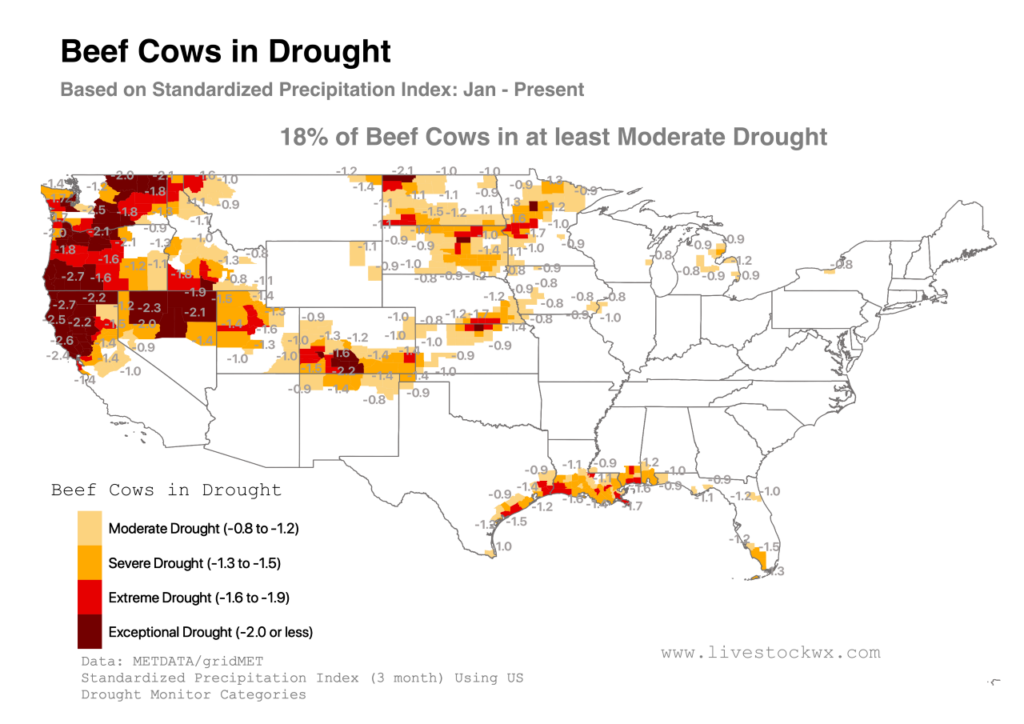
Given what’s going on with the cattle market and smaller numbers of cattle being placed into feedlots we wanted to also take a slightly different look at beef cows and drought this week. We usually show the US Drought Monitor, which is a compilation of multiple drought indicators, but given the potential for cattle spending a longer period of time on pasture this year, we wanted to focus more on precipitation deficits, and so have used data from the Standardized Precipitation Index (SPI).
SPI data are used in the Drought Monitor but so are other indicators which might not correlate as well with grass production. Based on 2019 survey data from NASS, we estimate there are approximately 18% of beef cows are in at least Moderate Drought. We do expect areas along the Texas Gulf Coast and into Louisiana to improve, however, parts of the Intermountain West and the West/Pacific Northwest could be headed for a long summer with somewhat limited grass production.
Recent Rainfall and Next 10-Days
As mentioned above, drought that is depicted along the Gulf Coast/East Texas and into Louisiana should improve in the next Drought Monitor given the good moisture they received earlier in the week. Unfortunately, the rainfall fell after the data cutoff for the Drought Monitor so improvements should be coming next week.
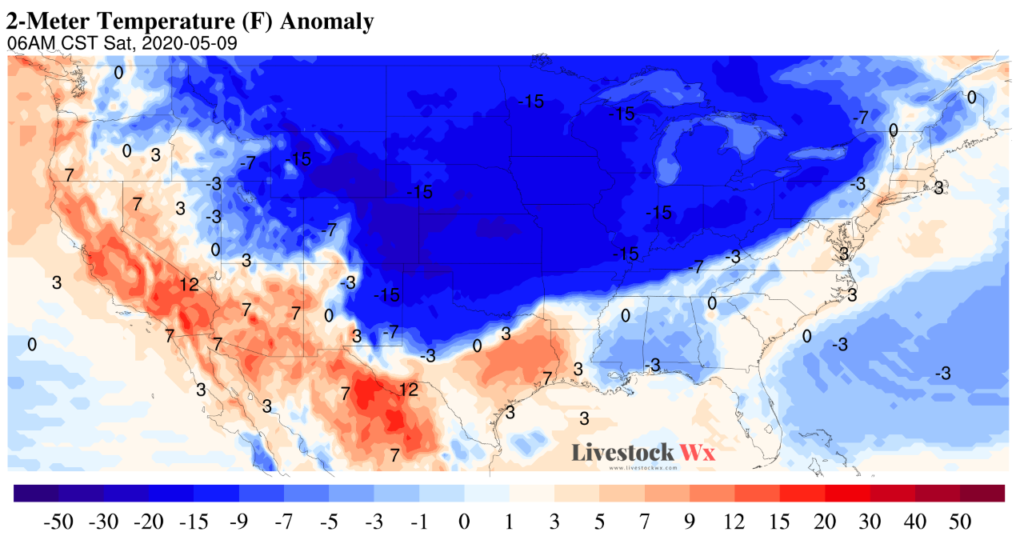
For the next 10 days the NOAA GFS model is showing we could see some significantly cooler temps starting around May 8-9 (map below). This coming after the current very warm trend.
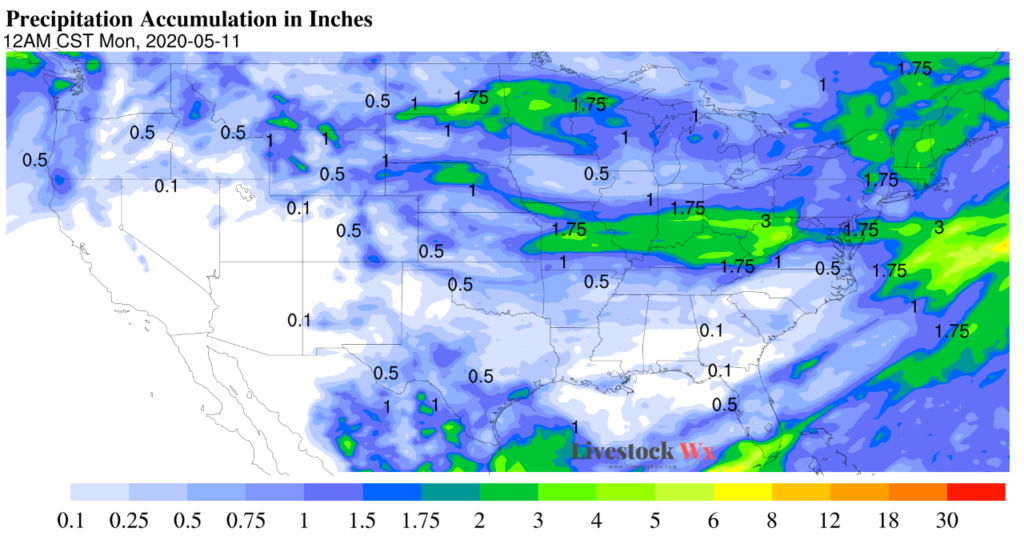
Precipitation (second map below) for most of the TSCRA region is not expected to be significant over the next week and a half, with the exception of parts of the Gulf Coast. Of course, 10-day forecast can fall apart relatively quickly so keep updated!