SPONSORED CONTENT
Feb. 28, 2020: Precipitation Frequency and Drought in South Texas
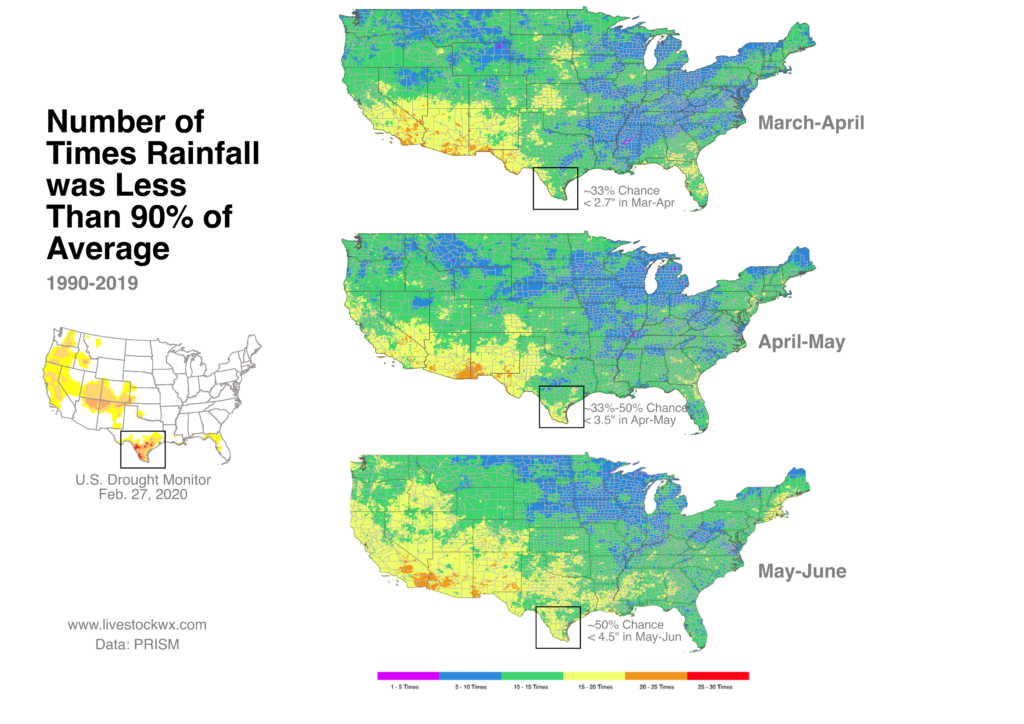
The latest U.S. Drought Monitor was released last Thursday (Feb. 27), which shows drought had improved in parts of Central and East Texas but there was almost no change in South Texas, Oklahoma or New Mexico. At the moment, Texas is the only state in the country that has an area or areas designated in Extreme Drought. There are 18 Texas counties that fall in the Extreme Drought category and most of those are in South Texas.
Now that spring is around the corner, we wanted to take a look at the chances South Texas has of improving its drought situation in the coming months. The below series of maps shows the number of times in the last 30 years there was less than 90% of average precipitation. We looked at two-month intervals (this analysis was originally done for the Pasture, Rangeland, and Forage Insurance product, which uses 2-month precipitation intervals) from March to June to see how frequently South Texas observed less than 90% rainfall. Understanding the frequency should help identify the chances drought there might improve or get worse. From the maps we see March-April have less of a chance of reduced rainfall but then as we move into April-May and then May-June the chance that rainfall could be less than 90% increases, even though those later months are one of the wettest times of the year for South Texas.
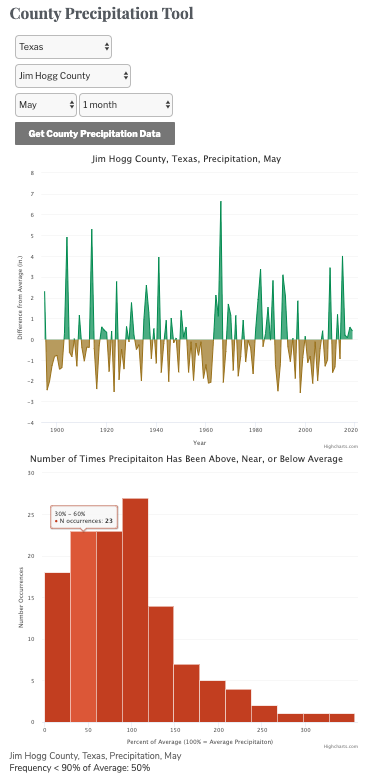
New County Precipitation Tool
For those that would like to see what the data look like for your specific county we have created a new tool that shows the precipitation frequency for each county for one month or a series of months. For example, we looked at Jim Hogg County for how frequently it observed less than 90% of average in May and June, which is about 2.25” and 2.5”, respectively.
It turns out for Jim Hogg, there is a 50% chance in May, and a 58% chance in June, precipitation will be less than 90% of average (see image below for June). Understanding the number of times precipitation has been less than or more than average is probably a better way to think about precipitation instead of assuming that the “average” for your area is the most likely outcome.
If you would like to see what your county looks like please visit http://livestockwx.com/anyone-can-look-at-average-precipitation-dont-be-average-check-out-livestock-wxs-latest-product-for-estimating-precipitation-frequency/ to test the tool out and read a bit more on why it could be more important to look at precipitation frequency as opposed to average precipitation.