June 30, 2020: What’s Driving Drought in June
The water cycle
Anyone know the Water Cycle song?:
…evaporation comes when the heat from the sun warms up all the groundwater
then it turns to water vapor
condensation takes over
it goes up to the clouds water vapor cools down
and it changes to a liquid, now precipitation happens…
Looking at changes in drought area over the last month it would help us to keep the water cycle song in mind because it hasn’t just been a lack of rainfall that’s been driving drought over the last 30 days. The maps below show departures from average for both precipitation and temperature from late May to present. You can see temperature departures have been centered over the middle part of the U.S. while the larger precipitation departures have been aligned slightly further east and south, affecting most of Oklahoma and Texas.

Change in drought
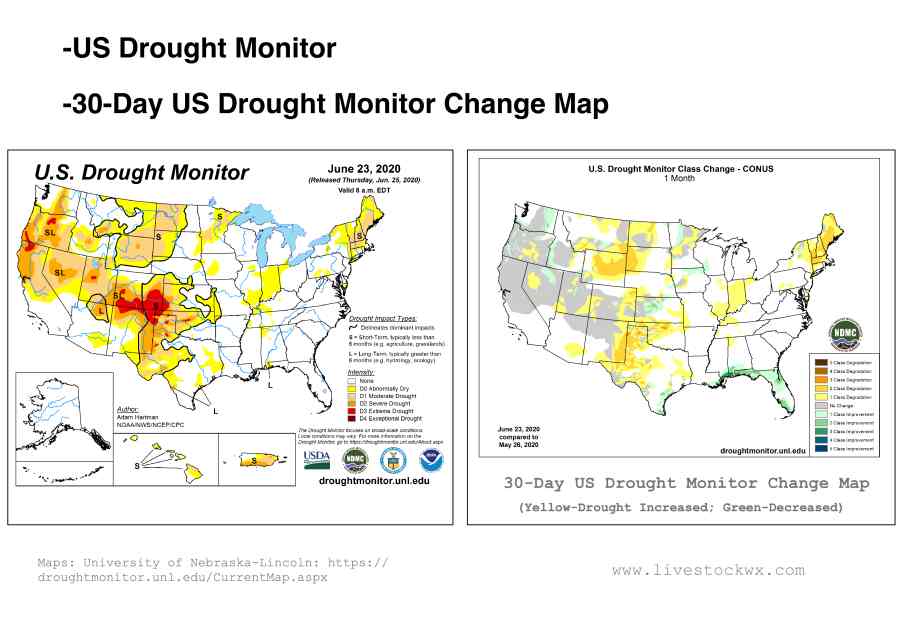
The below maps show the latest from the US Drought Monitor (released June 25) and the U.S. Drought Monitor Change map for the last 30 days. Yellow and browns show where drought has expanded and or intensified, while greens and blues show areas where it has improved. If you compare the areas where drought has expanded/intensified it doesn’t completely match up with those areas where the 30-day rainfall has been lacking.

Drying power of the atmosphere
While we all know temperature exacerbates drought, and in severe cases reinforces it like what we saw in 2011, we don’t always have a good feel for how it and other drying variables, such as wind speed, solar intensity, and relative humidity are making conditions worse.
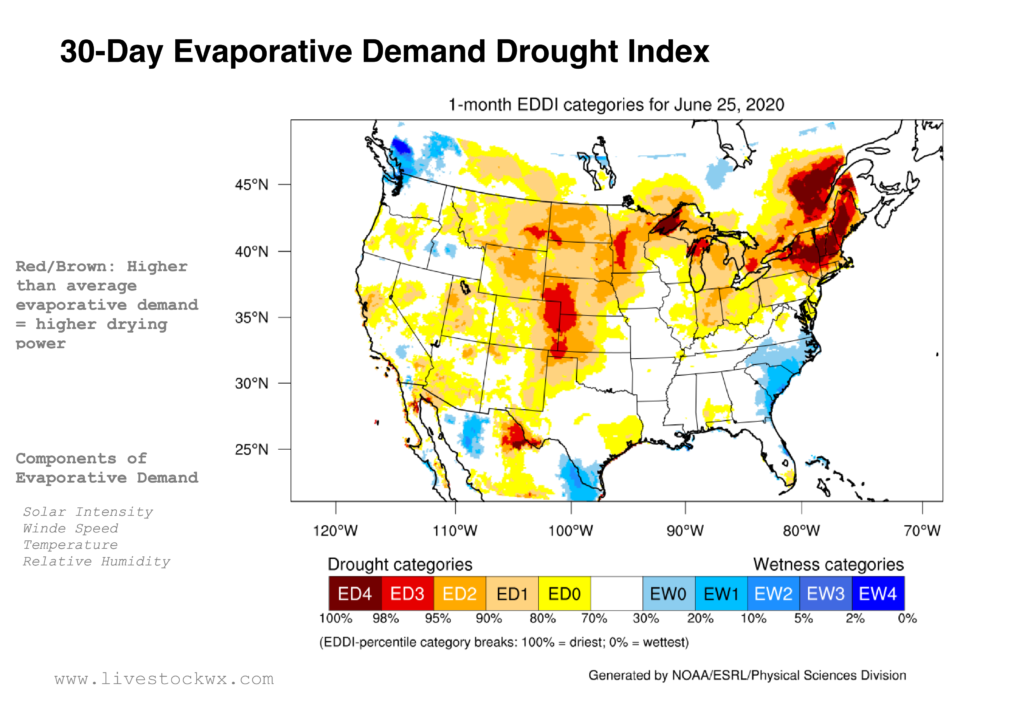
Thankfully, there is a nice drought index that was developed a few years ago by researchers at NOAA to look at these “other” factors and combine them into what is called the Evaporative Demand Drought Index (EDDI-pronounced Eddie). The EDDI assesses how much pressure the atmosphere is applying to moisture and thus moving it out of plants and the soil. Looking at the EDDI map (see below) for the last 30-days, the change in drought area and intensity starts to get a little more in focus.
For example, the Texas and Oklahoma Panhandles observed precipitation deficits of two or more inches in the last month, but when we include the EDDI, we see there was more going on, which could mean big changes in the U.S. Drought Monitor (which is what we’ve observed) or if we’re not careful, conditions on the ground could be worse than what many of our meteorological variable are indicating. It’s a good thing the U.S. Drought Monitor is now incorporating the EDDI in their analysis.

Drought changes over the next couple of weeks
As everyone knows, it’s not always easy to forecast precipitation, especially in the summer. What we are decent at, though, is forecasting temperature and some of the other components that are included in EDDI. If you want a good idea of where drought could be expanding, take a look at the forecasts for those components. The National Weather Service has a nice tool called the National Digital Forecast Database where you can see the seven-day forecast for some of these variables: https://digital.weather.gov/.
Based on the trends we’re seeing, it’s possible we could see further expansion and or intensification of drought in the Texas/Oklahoma Panhandles, Kansas, Nebraska, Wyoming, Montana and the Dakotas.
